Many companies delivering services based on applications running on cloud face much higher costs than expected. The problem is that over-provisioning is too often the approach taken to minimize risks, in particular when development and release cycles are getting shorter and shorter and there is no time for a proper sizing and tuning process.
When moving from on-premise to the cloud (often multi-cloud), growing bills may be disregarded during the migration, as this represents a strategic choice expected to deliver multiple benefits, including lower costs and higher business agility. However, sooner or later, growing cloud bills may hamper the ability to deliver services in a cost-effective manner.
The complexity of Kubernetes resource management mechanisms contributes to this situation. Tuning Kubernetes microservices applications represents a challenge even for the most experienced performance engineers and SREs. In fact, the manual tuning of one microservice typically requires several weeks.
This was the case of a European leader in SaaS-based accounting, payroll & business management services. Their development team was too focused on releasing frequent updates (for new functionalities and regulations) to ensure the cost efficiency of their services.
In the following, we will refer to this real-world case to illustrate some of the challenges in tuning Kubernetes Java-based applications (notice: the same does apply to any other language), in particular when autoscaling policies are in place. We will also show the benefits of the AI-powered optimization approach to automatically find the best tradeoff between performance, resilience, and cost.
Kubernetes autoscaling – a word of caution
Sizing containers and properly setting resource requests and resource limits is very important to ensure performance and resilience (read here why). Kubernetes provides built-in autoscaling capabilities that are often considered as the way to automate this sizing process. In particular, the Vertical Pod Autoscaler (VPA) recommends CPU and memory requests based on the measured pod resource usage.
When tuning Kubernetes in contexts where autoscaling is in place, it is important to be aware that Kubernetes autoscalers (including VPA) are based on resource usage only, not taking any application-level metrics such as response time into account. This may have significant implications on the performance and resilience of applications running on Kubernetes.
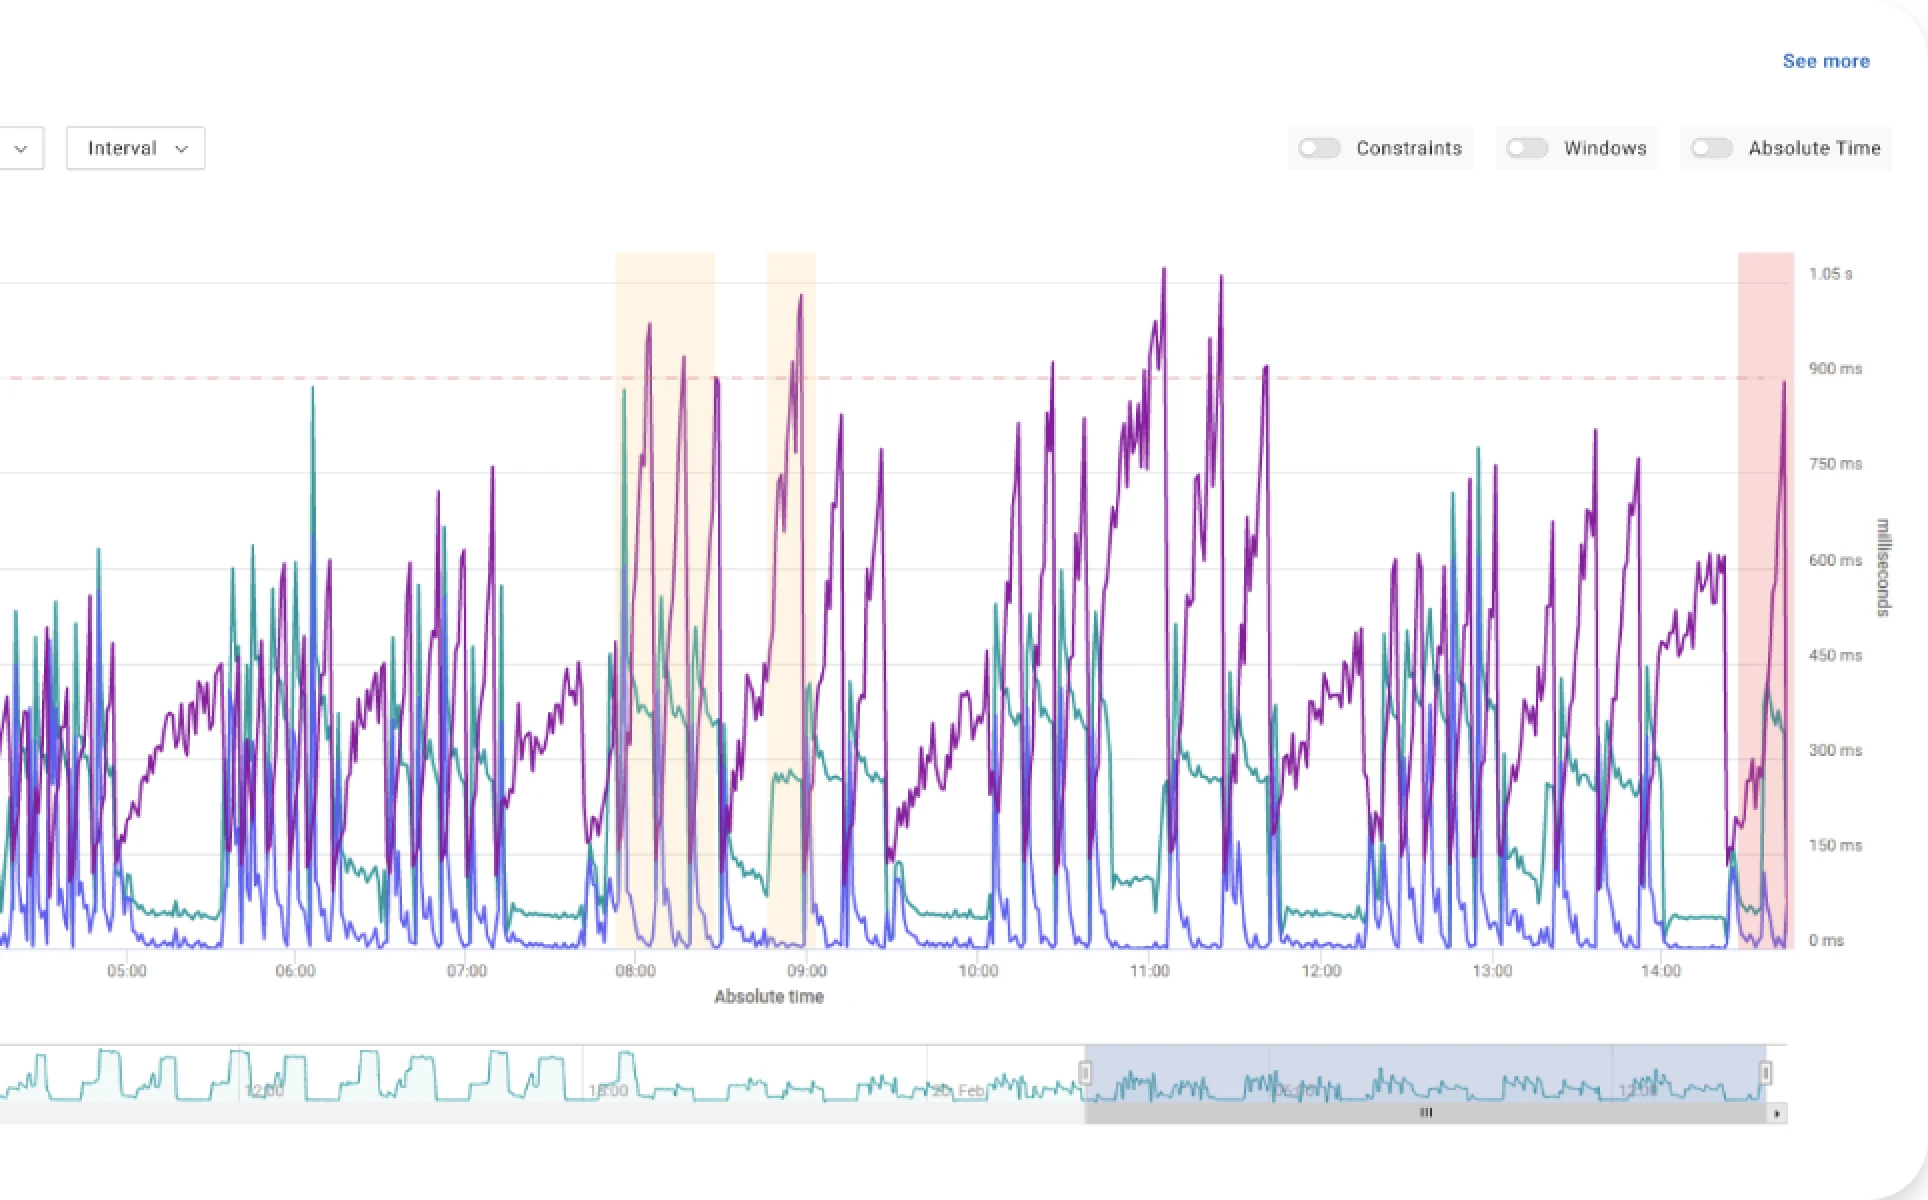
The following figure refers to a Kubernetes microservice serving some typical diurnal traffic pattern (i.e. an initial low load, followed by a high load and then again low load). The top-left chart shows the latency of this service and the defined SLO, while the lower charts show the resource request (left) and the corresponding resource utilization (right) for both CPU and memory.

After an initial period under some default configurations for resource requests, VPA was activated. Once activated, it reduced the assigned resources, in particular cutting CPU requests in half. Indeed, since the CPU utilization was below 50%, the service appeared to be overprovisioned. However, under the new settings suggested by the VPA, the latency of the service skyrocketed, thus the service no longer meets the response time SLO.
This demonstrates how important it is to evaluate the effects of the recommended settings as they cause severe service performance or reliability degradations. Of course, this adds to the complexity of tuning Kubernetes microservices applications to balance performance, resilience, and cost according to SLOs and other business constraints, primarily cost efficiency.
A real-world case
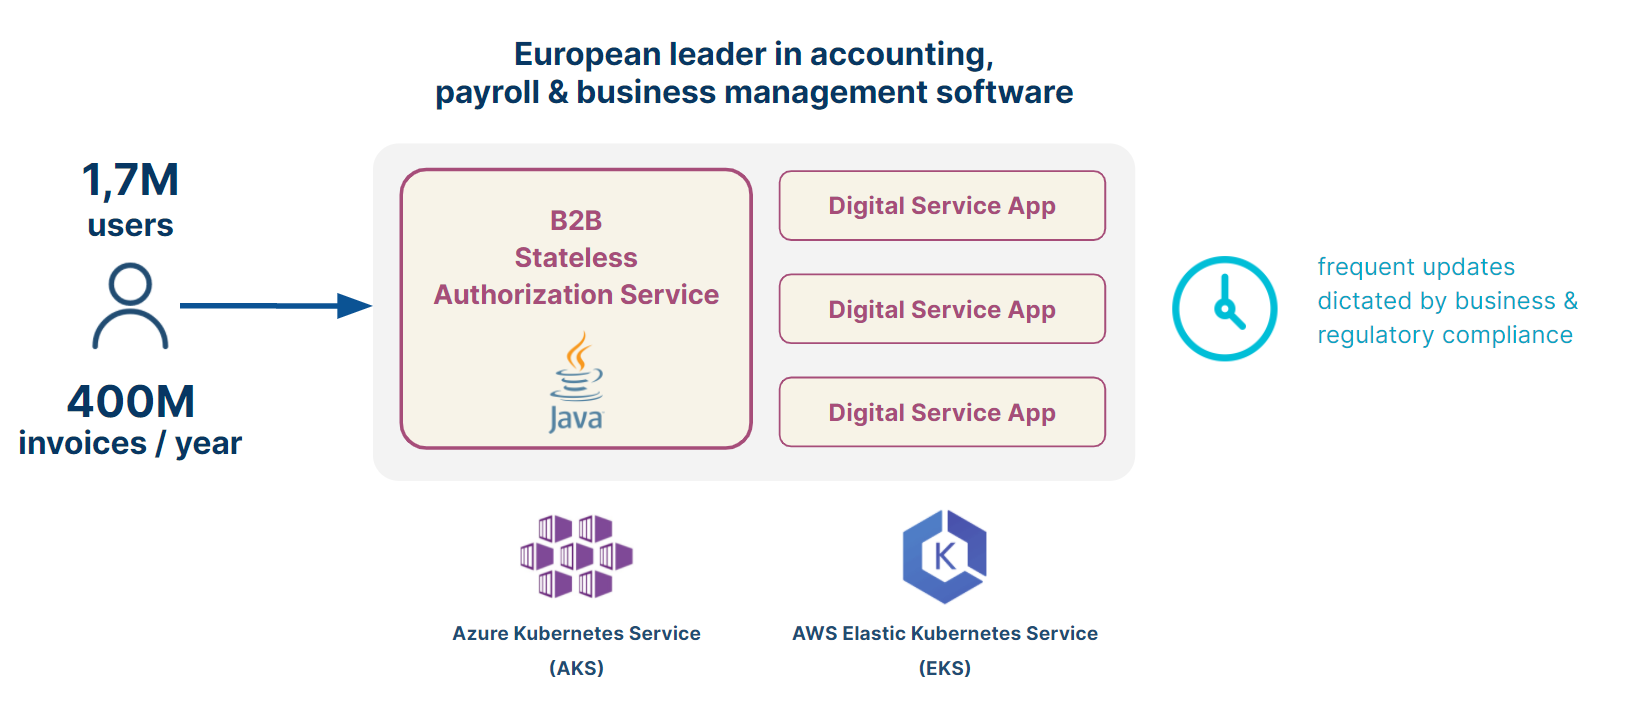
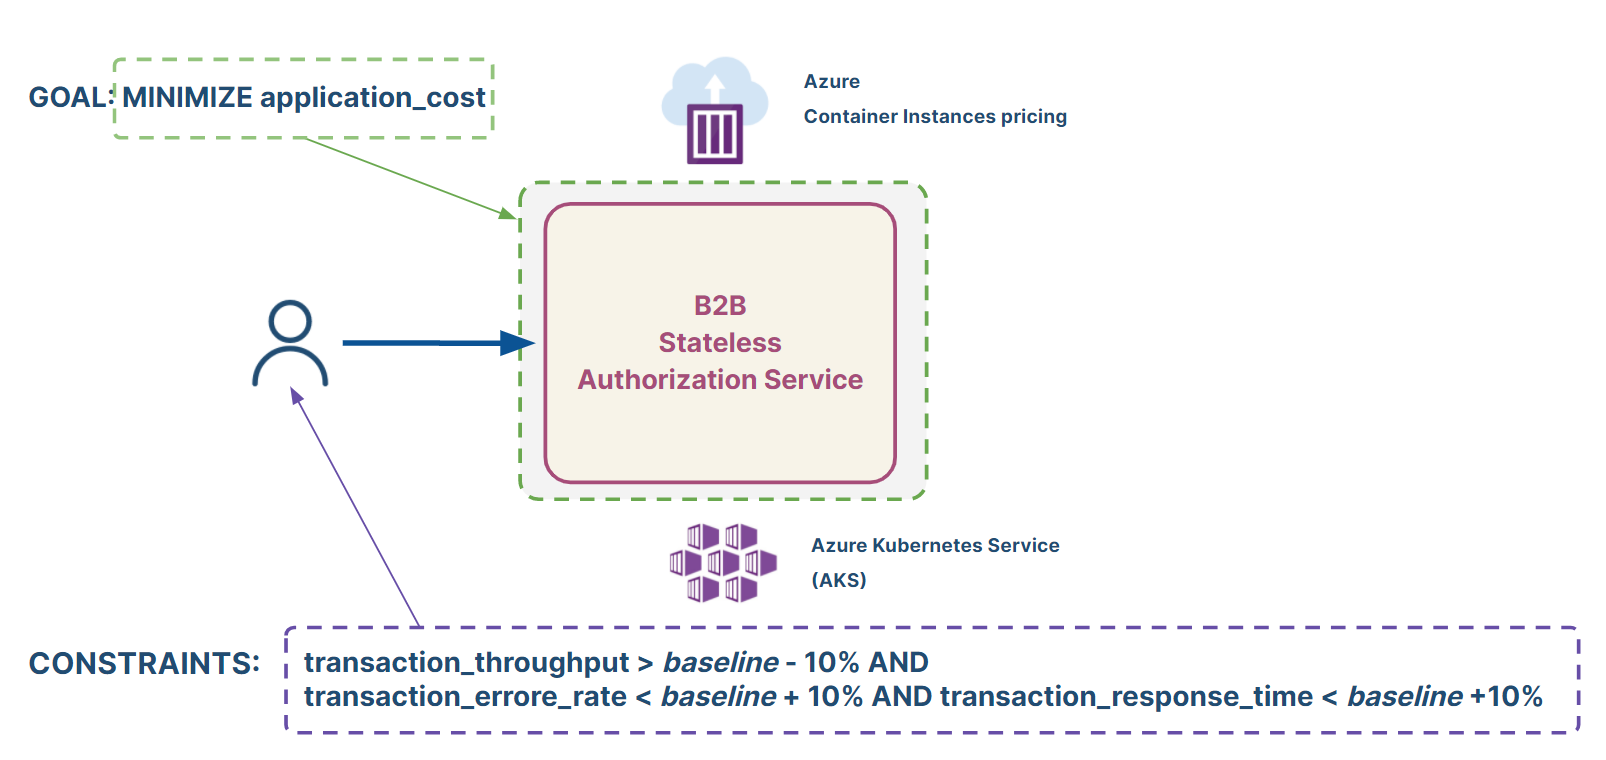
Our customer’s first optimization target was a Java-based microservice running on Azure, which provides the B2B authorization service leveraged by all digital services (see the following figure).
Below, is the baseline of key Kubernetes and JVM parameters for the pod supporting this microservice.
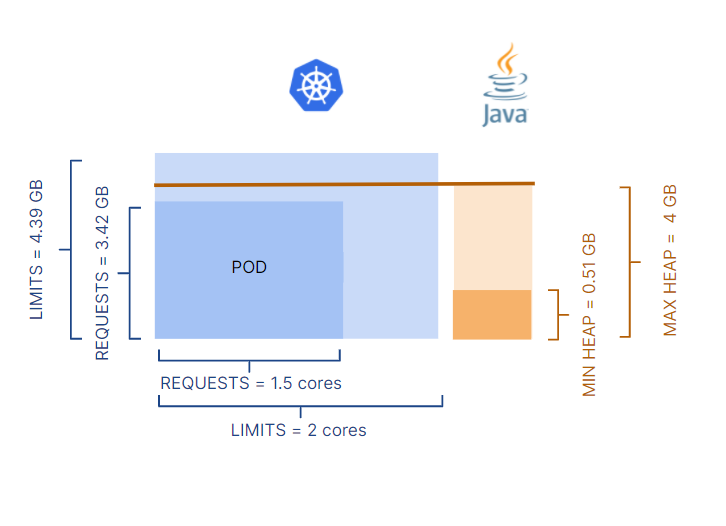
It is worth noticing that both CPU and memory resource requests were set lower (1.5 CPUs and 3.42 GB) than resource limits (2 CPUs and 4.39 GB). This is a common approach to guarantee adequate resources for the application to run properly, with some room for any unexpected growth. At the application runtime level, the JVM max heap was configured higher than the memory requests, meaning that JVM can use more memory than the amount requested.
In this environment, KEDA autoscaling was in use with autoscaling policies on both CPU and memory as scalers and triggering thresholds of 70% and 90% utilization respectively. These levels of utilization for triggering new replicas refer to resource requests, not limits. Therefore, if under load the CPU usage reaches 1 core (70% of 1.5 cores), a new replica is created.
As a first step, we run a load test replicating a diurnal traffic pattern with the microservice in the initial configuration. As illustrated by figure 4, this negatively impacts service performance and reliability as response time spikes due to the high CPU usage and CPU throttling during the JVM startup.
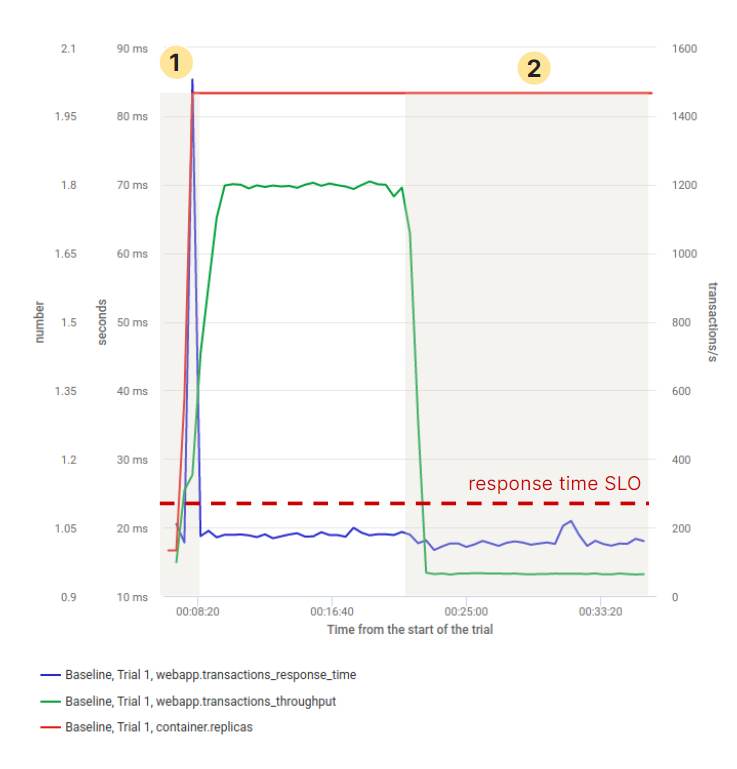
More interestingly, when the load drops the number of replicas does not scale down, despite the low CPU usage. This unwanted behavior is caused by the memory usage of the container remaining higher than the configured threshold of 90% usage (with respect to the memory requests). The combined effect of configurations at the container level and JVM level with autoscaler policies may have huge impacts on the cloud bill.
This confirms how tuning Kubernetes applications for both reliability and cost efficiency is not an easy task, as container requests and limits, autoscaling metrics and thresholds, and runtime flags all interact in non-trivial ways to the overall service performance and cost-efficiency. In this specific case, the unwanted behavior was caused by the JVM max heap having been configured higher than the memory requests. However, in other cases, this may be simply caused by a change in the application memory footprint due to a new application release.
AI-powered optimization to minimize cost
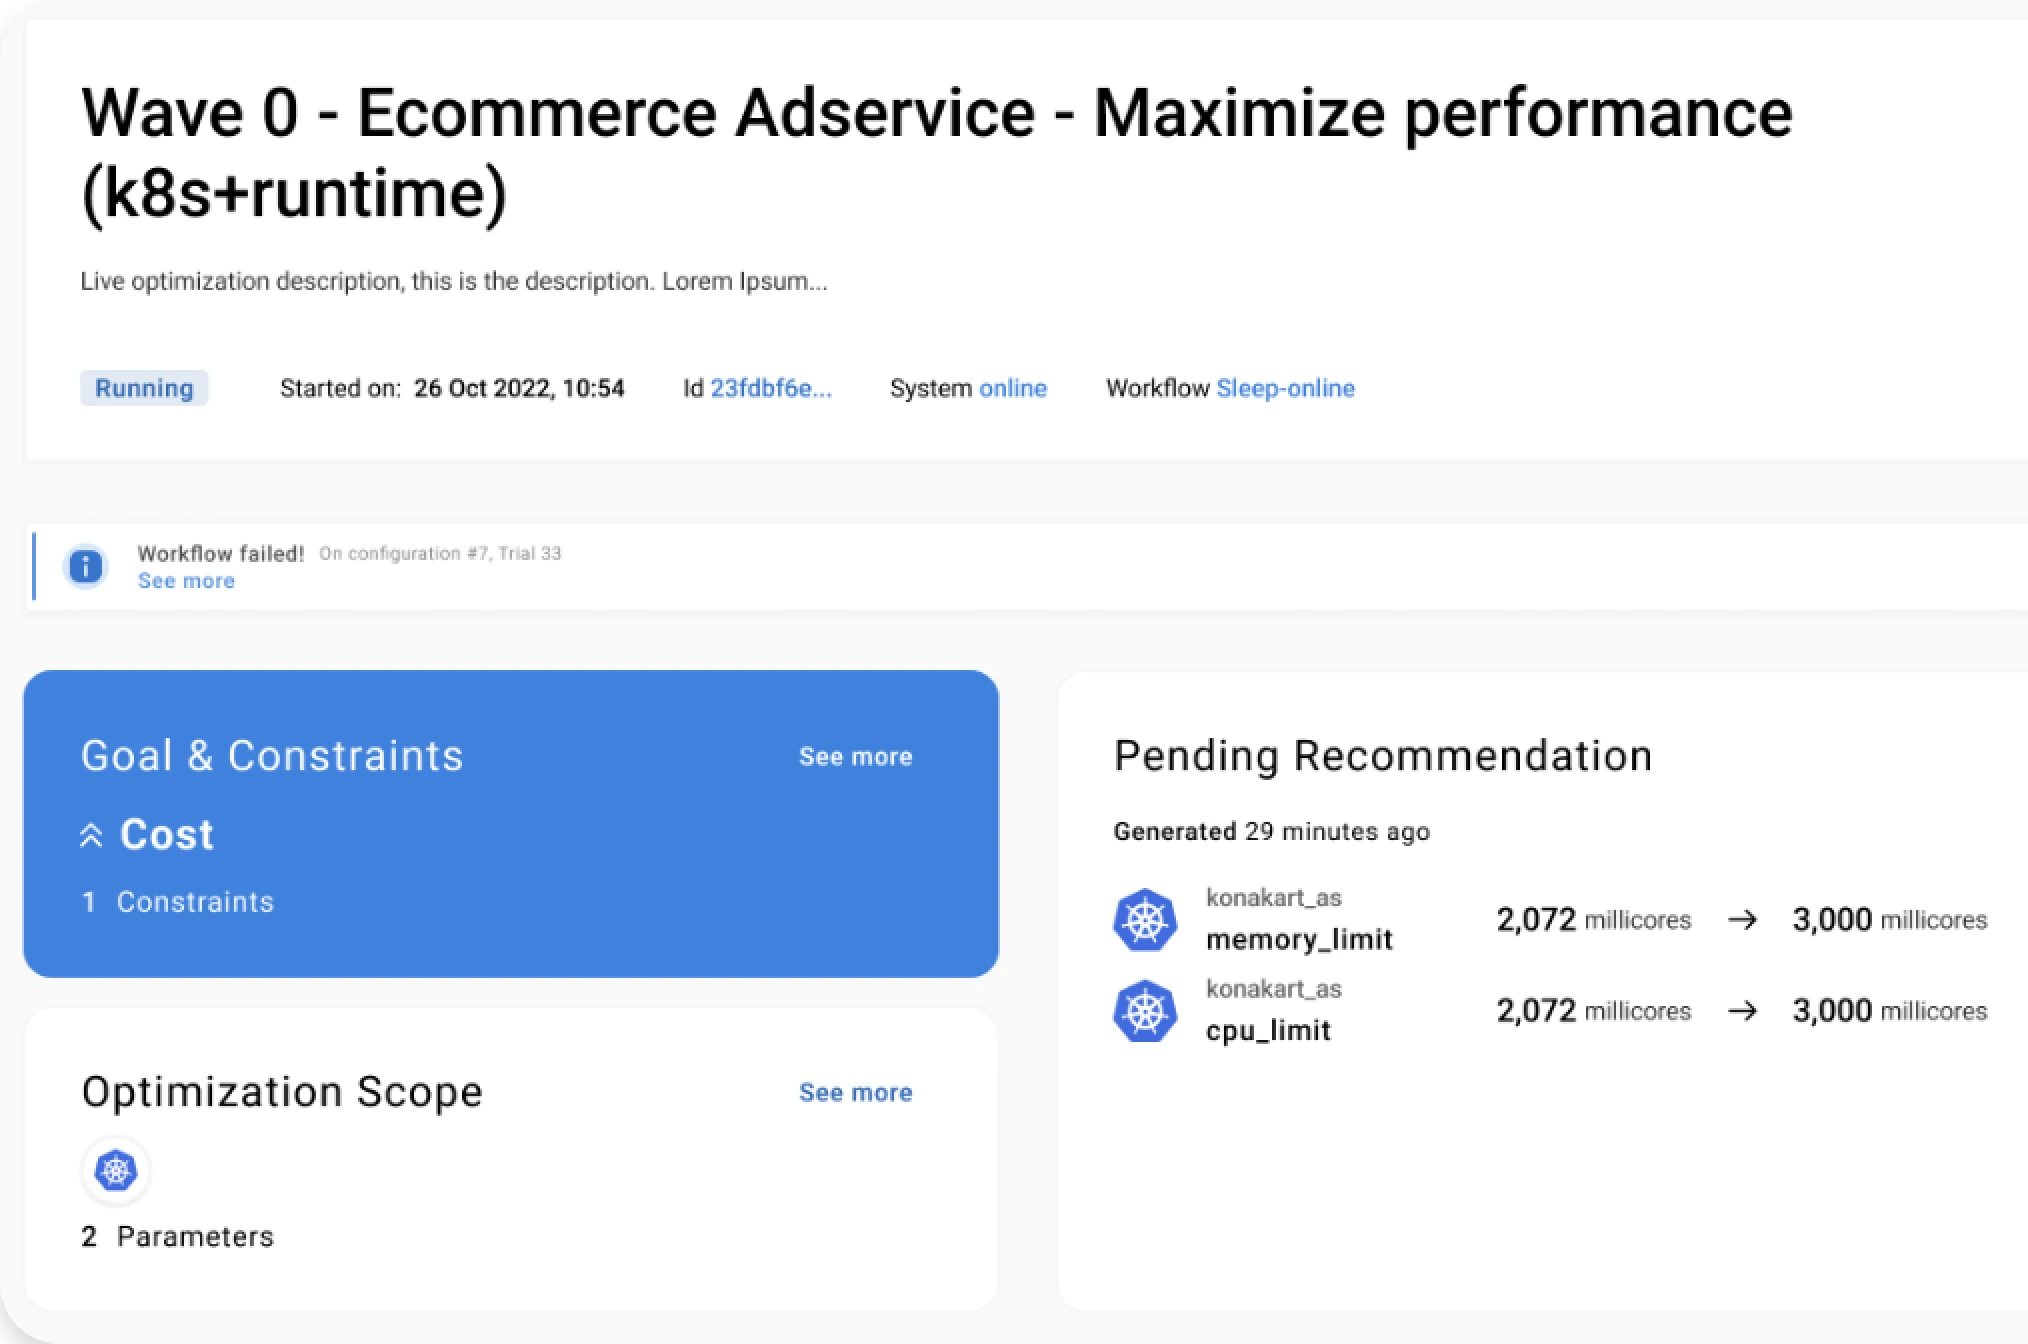
The first step in the AI-powered optimization process is to declare the optimization goal. In this case, the need was to minimize the overall cost of the service running on the Azure cloud, which in the Kubernetes environment depends on the amount of allocated CPU and memory resources. Constraints need to be specified to rule out configurations violating SLOs, such as throughput, response time, and error rate degrading more than 10% wrt the baseline.
The optimization study considered nine tunable parameters:
-
- Four Kubernetes parameters: CPU and memory requests and limits – which are critical for the overall service performance, reliability, and cost;
-
- Five key JVM parameters: including heap size and garbage collector type which impact the performance of containerized Java applications.
All these nine parameters are being tuned simultaneously, ensuring that the JVM is optimally configured to run with the chosen Kubernetes container resource sizing. This automated full-stack approach differs from the manual approach which works at tuning each layer separately.
The best configuration with respect to the defined cost-efficiency goal was identified by Akamas AI-powered optimization after a few dozen experiments, in about 19 hours. This configuration provided, with respect to the baseline, a 49% improvement on the cost and displayed a better behavior.

Two important differences can be easily noticed:
-
- The response time of the best configuration (right side chart) always remains within the response time SLO – and does not display any peak;
-
- Autoscaling is not triggered in the best configuration, as the full load can be sustained by a fixed number of replicas.
Therefore, the best configuration not only improves on cost but is also beneficial in terms of performance and resilience.
The following figure shows a side-by-side comparison of the baseline and best (lowest cost) configurations:
-
- Memory and CPU requests limits are set higher in the best configuration, which is somewhat counterintuive as Kubernetes is often considered well-suited for smalll and highly scalable applications;
-
- Max heap increased (by 20%) within the container memory requests (also increased to 5 GB) and the min heap size adjusted to be almost equal to the max heap. This latter setting can help avoig garbage collection cycles expecially in the startup phase of the JVM.
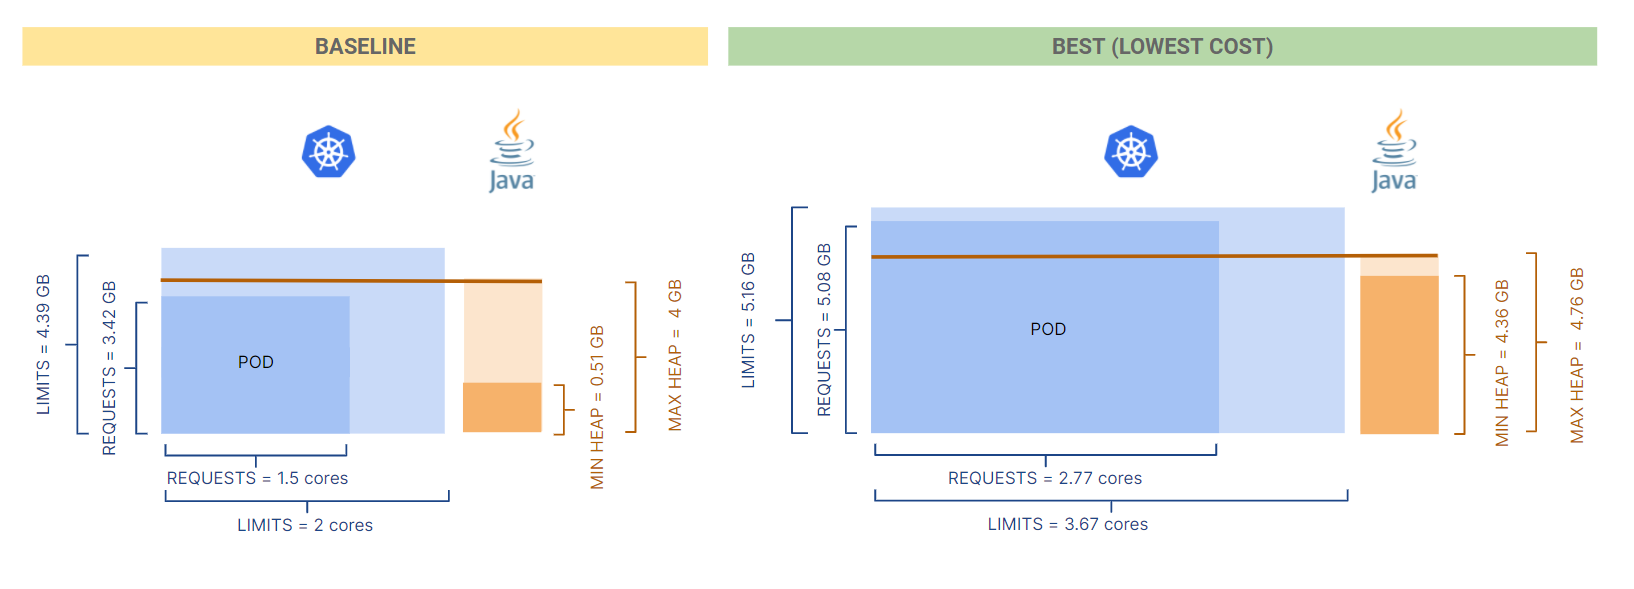
In this configuration, the pod size is significantly larger in terms of both CPU and memory. As a consequence, autoscalers are triggered less often even if this implies a higher fixed cost than the baseline. This apparent paradox can be explained by considering that container and runtime parameters are now better aligned. The JVM max heap is lower than memory requests which helps scale down the application.
As it is often the case, in addition to the best configuration with the defined goal (here cost-reduction) other sub-optimal configurations were analyzed. After just a dozen experiments (in about 8 hours), another interesting configuration was found, which slightly reduced the cost (by 16%) but displayed a much better behavior in terms of resilience:
-
- Lower response time peak upon scaling out (less than half);
-
- Replicas scaled back after the high load phase.
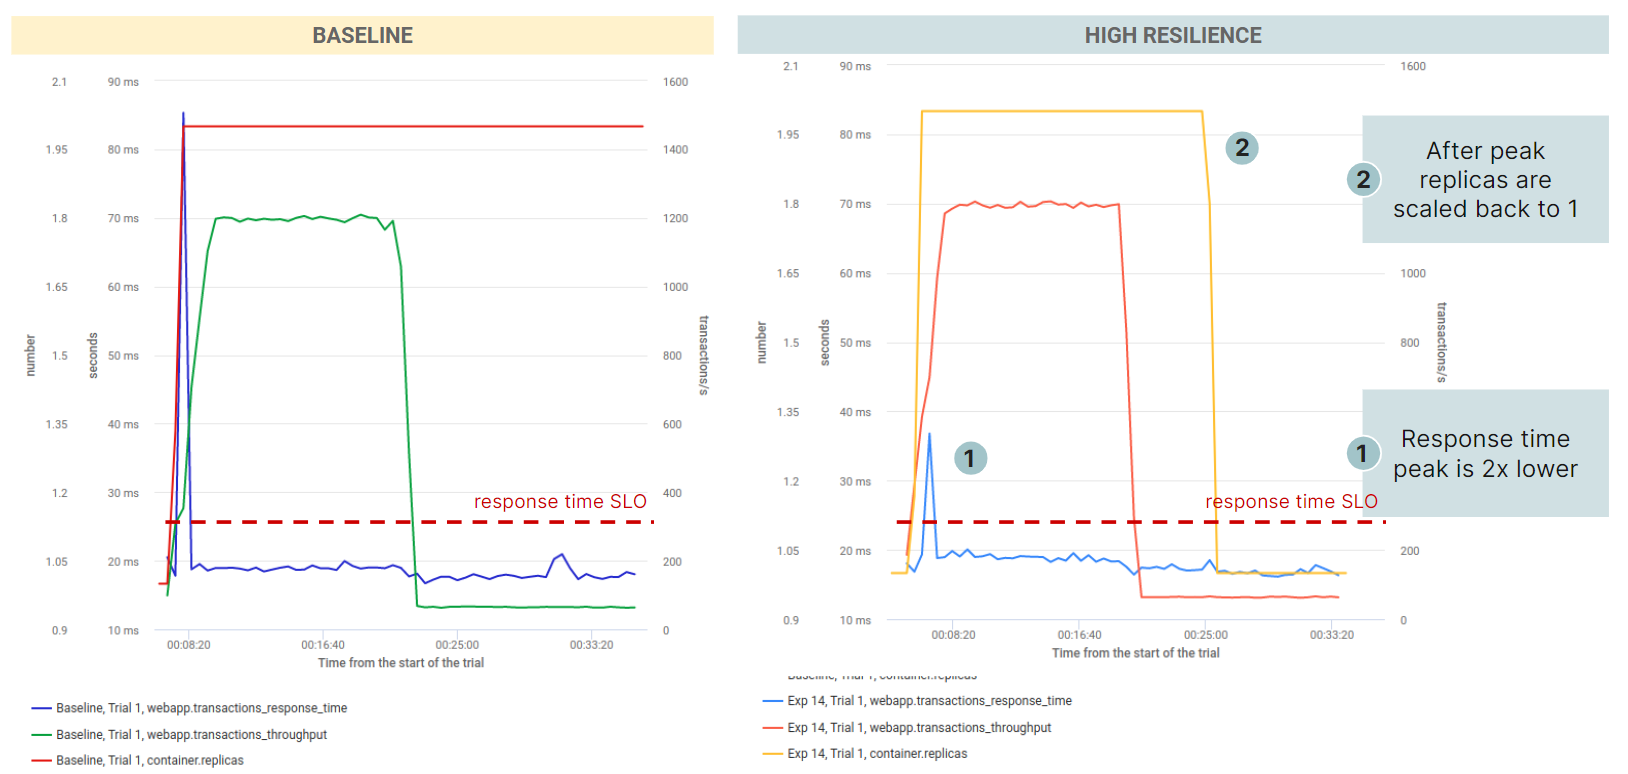
In this “high resilience” configuration, CPU requests are smaller (while limits are higher) than in the baseline, while memory requests are higher than in the best configuration. Several JVM options are changed with respect to the baseline, including the garbage collector type being set to “Parallel”, which is more efficient in terms of CPU and memory usage.
Interestingly, this higher resilience configuration was found by looking for a cost reduction configuration. Likely, an even better configuration in terms of service resilience could be found by stating this as a goal and relaxing other constraints. While this was not the customer’s goal, the value of leveraging AI-powered optimization to automatically identify in a short amount of time configurations for complex applications was clearly understood.
Conclusions
These days, a manual approach to tuning Kubernetes applications with dozens or more microservices is simply not feasible as it requires dealing with hundreds of parameters and taking into account the interplay among multiple technology layers. This is especially the case if Kubernetes utilization-based autoscaling mechanisms are in place.
Only Akamas AI is able to automatically take all these factors into account to identify the best configurations, without requiring any human intervention nor any knowledge of the application, Kubernetes setting, and autoscaling policies.
Thanks to Akamas developers, service architects, performance engineers and SRE can properly size and tune their critical services to optimize their applications and get insights on potential tradeoffs among competing goals. Akamas approach only requires declaring the desired goal (e.g. minimizing cloud cost or maximizing resilience) and constraints (e.g. a response time SLO).
As a result, Akamas can deliver meaningful cost savings at business speed, improve application performance and resilience as well as improving the operational efficiency of all roles and teams involved in delivering high-quality services in a cost-effective way.
Keep reading our blog to learn more stories from our customers. Stay tuned!

Author:
Stefano Doni
Co-founder & CTO