The Java platform continues to be developed and improved over time. The OpenJDK community has been quite active in improving the performance of the JVM and the garbage collector (GC): new GCs are being developed and existing ones are constantly improved with the goal to make Java applications run faster and more efficiently.
So when looking for how to improve application performance, we may wonder whether we should still tune the JVM, or simply rely on newer versions of the JVM and just take advantage of the improved out-of-the-box performance and new low-latency garbage collectors. In other words, shall we leave the JVM to take care of the application performance and efficiency problem for us? This is an important question, as the Java platform is very popular and millions of applications are powered by the JVM.
In this post, we seek to answer this question. In our labs, we execute extensive performance testing and benchmarking experiments to better understand how JVMs behave and how to best optimize them. In the following, we will present the results of a couple of studies that demonstrate that JVM tuning and proper GC selection continue to be important activities that can greatly improve application performance and efficiency (hence cost). If you care about application performance, costs and resiliency, we argue that it is better not to “just leave it to the JVM”.
What is the best JVM garbage collector?
G1 is the default garbage collector since OpenJDK 9. It is a significantly more complex collector with respect to other collectors like Parallel, as it has many internal heuristics that govern when to collect garbage, how much of it, how much memory to allocate – all of which ultimately impact application performance and efficiency.
A first study was devoted to understanding how G1 GC behaves in terms of application performance and resource footprint under varying heap sizes. As regards the experiment setup, we leverage Renaissance, a popular open-source Java benchmark.
We ran several experiments by increasing the Java max heap from 2 GB to 5 GB (all other JVM options were kept at the default). During each run, some key metrics were measured: application execution time, max heap memory used, and some GC-related metrics like GC time (aka overhead), GC CPU time and pauses from the GC log files.
The following figure shows the result of this study.
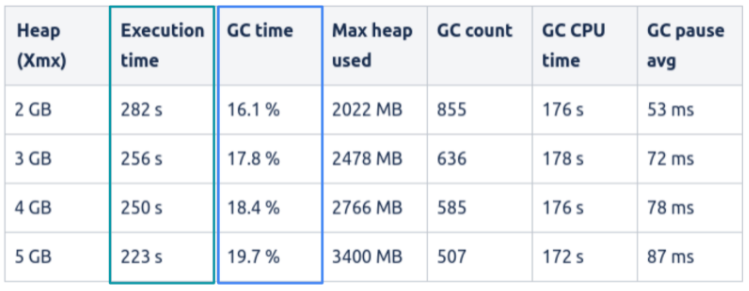
Several interesting observations can be drawn from these results. As intuition would suggest, the execution time decreases as more memory is allocated. However, the GC overhead percentage increases with larger heaps: this is quite counterintuitive and probably the opposite of what we might have expected. To learn more about JVM metrics as bad predictors of real application performance you may want to read this blog entry.
But there is an even more interesting G1 behaviour to notice. Let’s look at the experiment with a 5 GB heap (see row highlighted in the following figure).
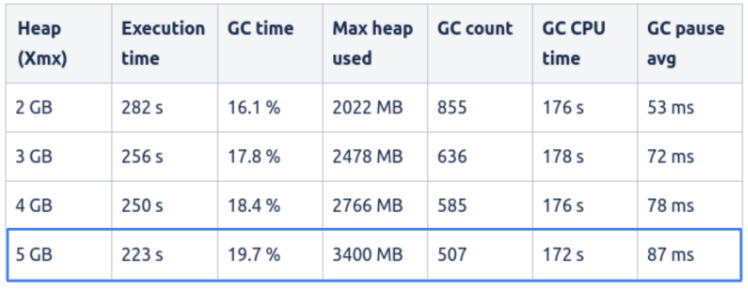
In this case, the GC time (aka GC overhead) is close to 20%, already a significant amount – meaning that application threads are halted for 20% of the time. Still, the G1 GC algorithm decided to only use 3.4 GB out of the 5 GB of memory available. In other words, G1 did not inflate the heap even if 1.6 GB of additional memory was available. Furthermore, G1 did use a significant amount of CPU time: 172 seconds of CPU time were spent by the GC. If we consider that the execution time amounted to 223 seconds, this means that almost 80% of one CPU core was spent doing garbage collection work.
So, what is happening here? Basically, G1 traded off CPU and application throughput to be more memory efficient. This is a common G1 behaviour we have seen several times in production Java applications. This looks great, but what if our goal was to lower CPU usage in order to achieve higher application efficiency and lower cloud costs? Or perhaps, what if we wanted to achieve higher application throughput? Well, it seems that G1 had different goals here.
Why is that, you may ask? The JVM – or more in general, any language runtime, or even OS and DBMS – needs to make lots of complex decisions around performance and resource management, and it does so using built-in heuristics, a set of rules, and thresholds that are implemented based on the GC design goals. Such heuristics may behave (sometimes wildly!) differently with respect to our end-to-end application performance or efficiency goals. And most importantly, they are based on internal JVM metrics, not on real application performance indicators.
What is the best garbage collector?
A second study focused on analyzing how much the choice of the GC may impact application performance and resource footprint.
We used the same experimental setup of the previous experiments, with the only exception that we kept an 8 GB heap size throughout the experiments. This time we used OpenJDK 15 in order to assess the performance of the newer low-latency GCs. Here are the GCs we tested:
- Serial: the single-threaded GC, a simple but efficient collector for small memory footprint;
- Parallel: the multi-threaded GC, ideal for throughput-oriented applications;
- G1: the multi-threaded GC, designed to offer a good tradeoff among latency and throughput;
- Z and Shenandoah: the new low-latency GCs available from OpenJDK 15.
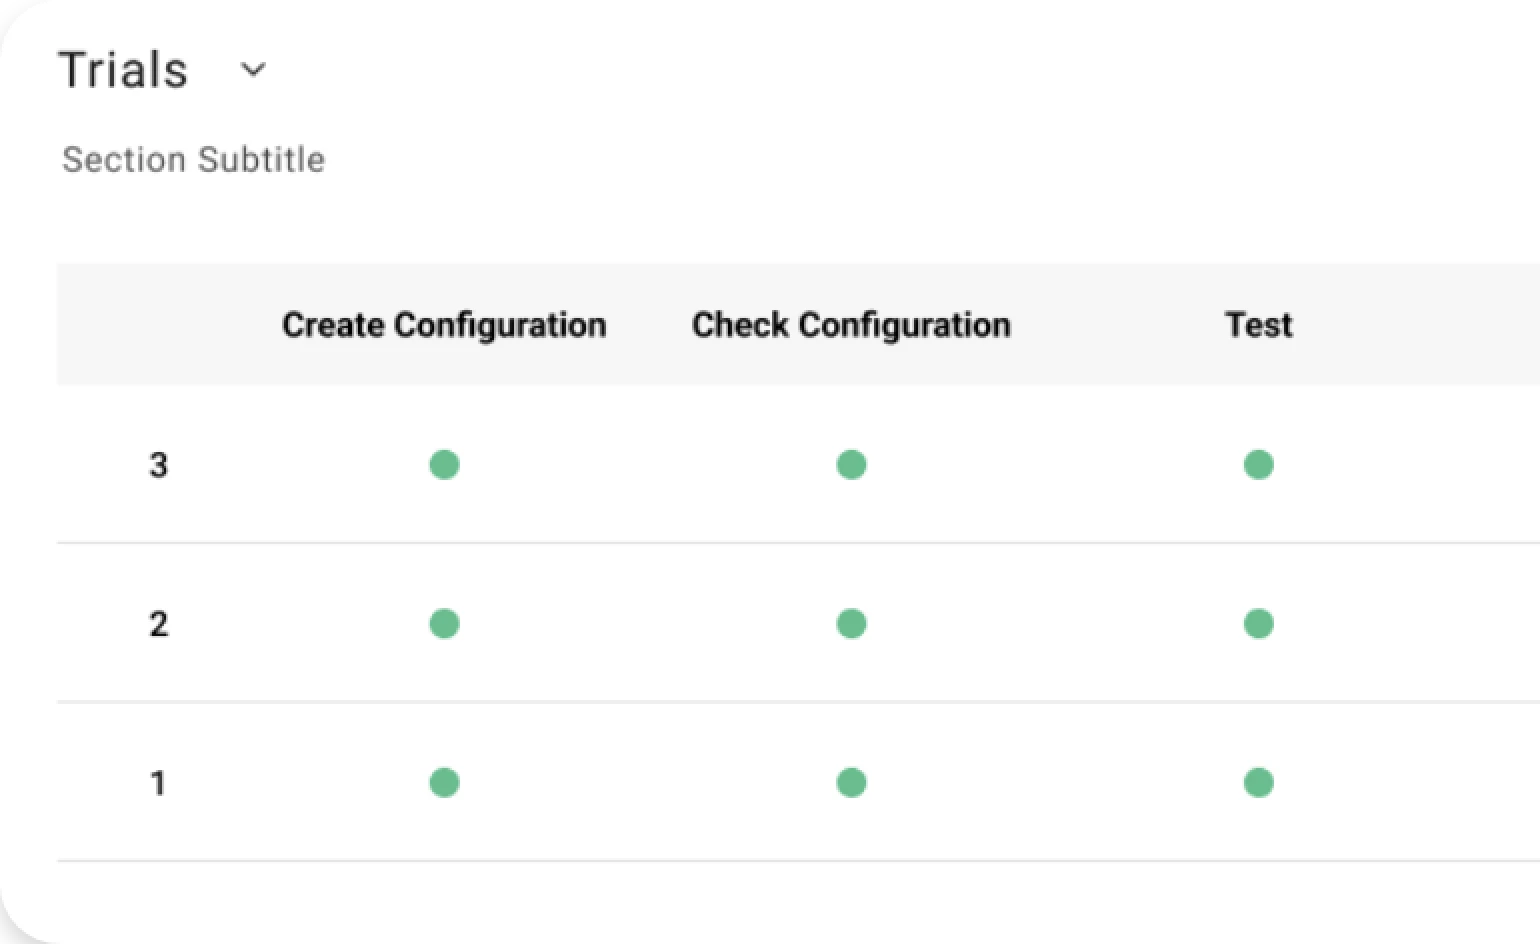
In this study, we leveraged our Akamas platform to automate the process of executing benchmarks, gathering key performance metrics, and automatically computing performance deltas. Akamas also helped in ensuring repeatable and stable results by automatically excluding warmups and running multiple trials to assess low variability.
The following figure displays the results of the study in terms of application performance (the Score, first column) and resources usage metrics for different GC types (last column in the table). All delta values (in percentage) are related to the baseline (including the Score), which is G1 GC.
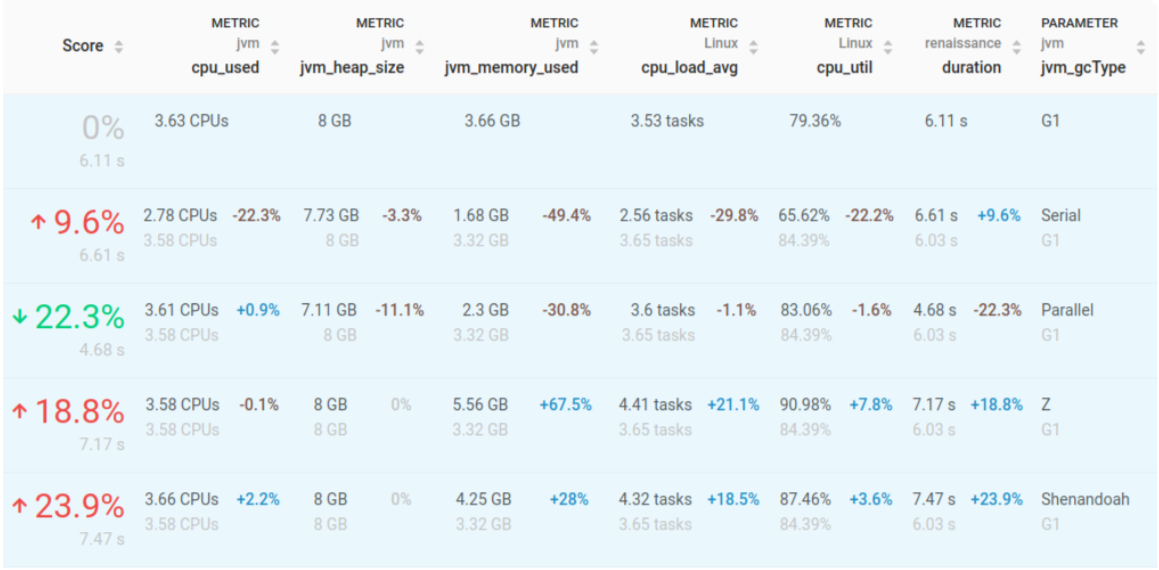
The results of this study are quite interesting:
- Parallel wins as the best GC for this application, being about 22% faster than the default JVM configuration (G1). Interestingly enough, this GC is also more efficient in terms of memory, as it consumes 30% less memory;
- Serial GC is performing surprisingly well: while being about 10% slower, it is extremely efficient resource-wise as it reduces CPU utilization by 22% and almost halves the memory usage with respect to the default JVM configuration (G1)! This is quite notable, as here we are working with a not so small heap: the single-threaded nature of this collector does not seem to impact that much for this application;
- Z and Shenandoah are both significantly slower and inefficient memory-wise. In particular, Z consumes a lot more memory (67%) than the default JVM configuration (G1). The operating system load average is also much higher, most likely due to the more concurrent work that these GCs need to perform.
While the above results are valid only for this application, we have seen similar results for several customer production applications, thus confirming that the default JVM configuration and GC may be very far from optimal for a specific application and the specific performance requirements. And while GCs constantly improve and evolve to be more performant in every possible scenario, we believe that the need to tune the JVM and select the right GC will remain. As stated by Aleksey Shipilev, developer of the Shenandoah GC and leading JVM performance expert, in his presentation at Devoxx Belgium in 2017:
Universal GC does not exist. You have either low latency, or high throughput or low memory footprint. For your application you have to decide which GC you want to use.”
Aleksey Shipilev – Principal Software Engineer, RedHat
Conclusions
We asked ourselves whether JVM tuning still has a place today, when new JVMs are constantly being released with ever greater performance improvements.
In this post, we demonstrated the potential impact of choosing the best GC for your applications. Despite great performance improvements, JVM remains a complex system whose default behaviour does not necessarily match your specific performance requirements. By just relying on JVM to take care of application performance, efficiency, and reliability goals, chances are you are leaving significant improvement potential on the table.
It is important to be aware of how much space there is for greatly improving the performance – as well as resilience and cost – of our applications, by identifying the JVM parameters that are optimal for each specific application and workload. In today’s world of complex architecture relying on multiple technologies each providing dozens or hundreds of different parameters (that sometimes also change behavior from one version to another) can be a rather daunting task that cannot be accomplished just by relying on pre-defined rules and vendor best practices.
Akamas provides Performance Engineers with the ability to optimize application performance by smartly exploring thousands of configurations, without relying on predefined rules and human knowledge. Akamas specialized AI techniques can find the optimal configuration with respect to your custom goals (e.g. performance and cost tradeoffs) and constraints (e.g. SLOs), in just a few hours.
In the following blog entries, we will continue to debunk other JVM performance tuning myths and advocate for a new approach to performance optimization. Stay tuned!

Author:
Stefano Doni
Co-founder & CTO